

data visualization
For data to be actionable, it has to be understood. Our scientific strategists and designers have invested countless hours exploring new ways to visualize data with the goal of helping provide perspectives or undertstand the implications of datasets.
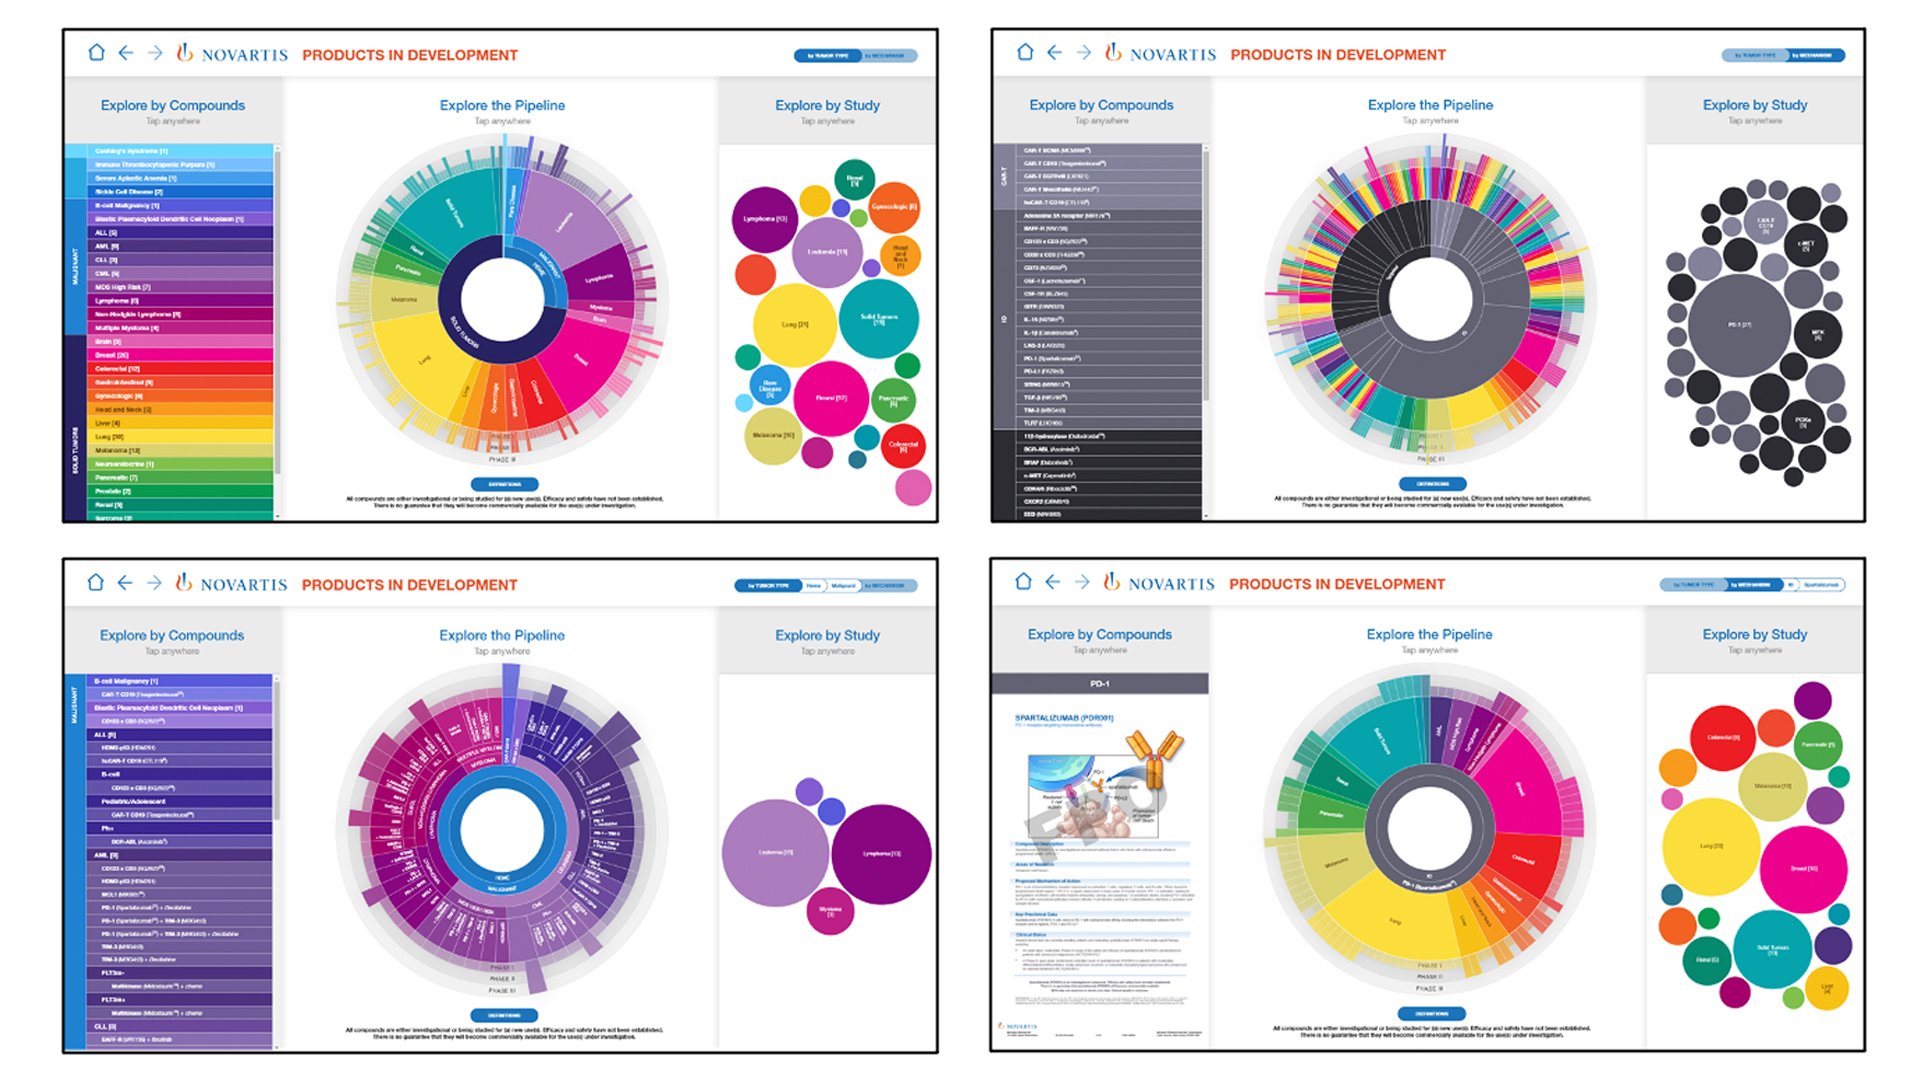
Interactive Data Explorer
Sometimes data sets need to be sorted and re-sorted by looking at different values. In this example, we developed an interactive navigator allowing users to sort through investigational compounds within a pipeline either by disease, phase or modality. The content could be easily updated by changing values within a linked spreadsheet.
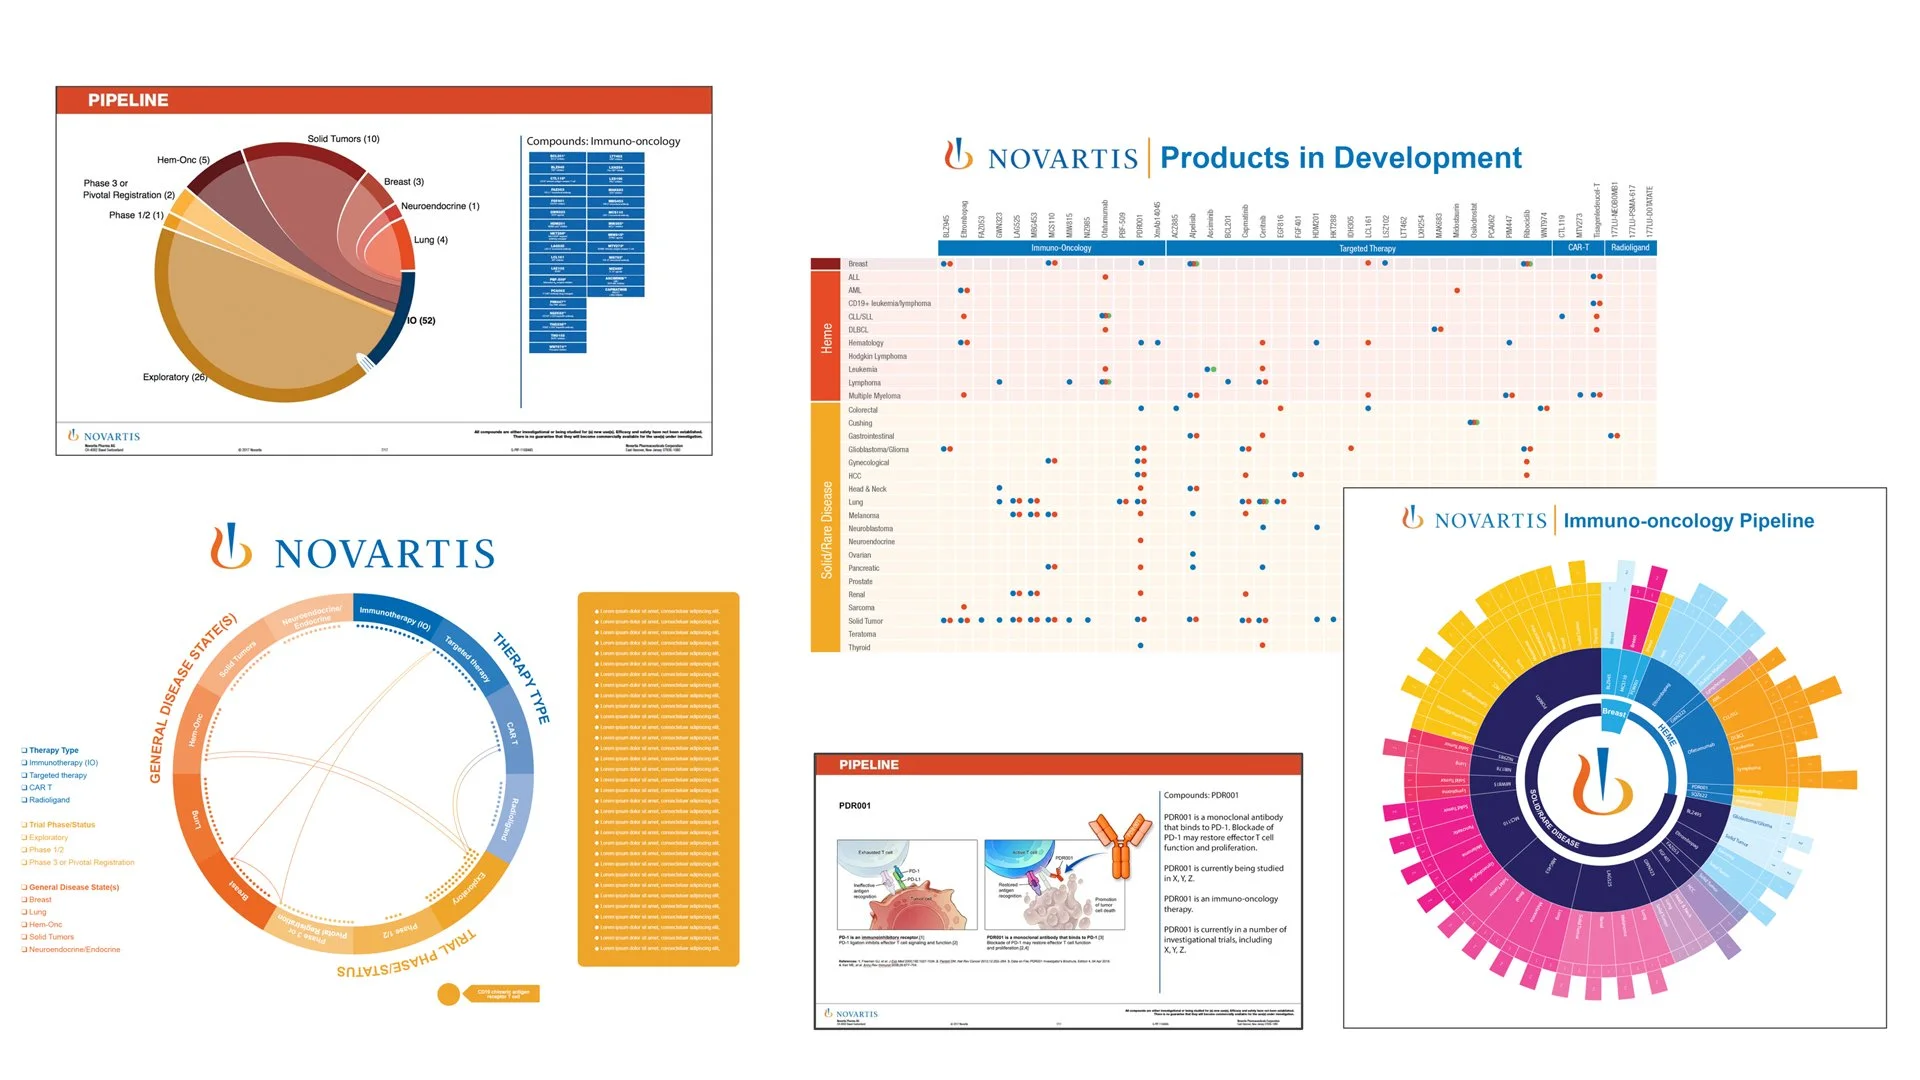
Data Presentations
Our data visualization solutions work hand-in-hand with slide design, providing cohesiveness across presentation materials. Our team provides consultation on scientific story flow, strategy, clarity, and aesthetic consistency.